
2 Weeks, 130 Knots, and a Swept Wing: Inside NASA’s Inboard Model Test Campaign for Icing Data
We compile, generate and translate using Artificial Intelligence from the below given source. Macro Micro News is responsible for its editorial publication.

NASA Glenn Research Center, Cleveland, Ohio, Source :
In February 2015, NASA engineers spent two weeks doing something that sounds simple and requires careful precision: they froze a swept wing on purpose. The Inboard Model Test Campaign, part of the Swept-Wing Icing Research effort under the Common Research Model program, was built to capture what happens when ice forms on the inboard section of a swept wing during flap deployment. That area is especially interesting because the fuselage, high-lift devices, and complex airflow all meet there. When ice enters that picture, the aerodynamics can shift in surprising ways.
Have you ever wondered how researchers know what ice does to a wing before an aircraft ever flies? The answer is wind tunnels, spray bars, and carefully chosen test matrices. Over two weeks, from Feb. 24 to March 6, 2015, the team exposed an inboard wing model to a range of icing conditions that mimic real flight environments. Total air temperatures ranged from about -23.8°C to -1.4°C. Velocities held steady at 130 knots. Median volumetric diameters, or MVD, ranged from 20 to 35 microns, and liquid water contents, or LWC, went from 0.6 to 1.4 g/m³. The angle of attack varied between 2.1 and 4.4 degrees, and a subset of pressure measurements included flap settings from 0 to 15 degrees. These are the kinds of conditions a turbine-powered transport aircraft might encounter while holding or descending through clouds with supercooled water droplets.
What makes the campaign so useful is the level of detail in the test log. Every data row includes tunnel and spray parameters like air pressure, water pressure, spray duration, and the exact time the spray system switched on. The first entry, run TG2401, took place at -8.7°C, 130 knots, an MVD of 25 microns, and an LWC of 1.0 g/m³, with a flap setting of 13.6 degrees. Later runs moved into colder air, tested bigger and smaller droplets, and adjusted water content. One run held the total temperature at -20°C with 35 micron droplets and 0.6 g/m³ LWC. Another used 20 micron droplets with a slightly higher water content. The result is a matrix that allows researchers to separate the effects of temperature, droplet size, and water concentration on ice shape.
Beyond the tunnel conditions, the campaign produced a pressure coefficient dataset organized by RDG number. That data lists angle of attack, flap deflection, and tunnel speed, which helps explain how the pressure field along the inboard wing changes as ice accretes and flaps move. Photos of the ice shapes and ice accretion mass data accompany the test records, so modelers get both visual and quantitative benchmarks.
So what does this mean for modern aviation? Ice accretion on swept wings is a known challenge, especially on nacelles, slats, and flaps. On the inboard wing section, where airflow is influenced by the fuselage and high-lift systems, ice can change flow separation timing and stall behavior. The Common Research Model offers an open, well-documented geometry that lets industry and academia validate their computational tools against physical test data. The Inboard Model Test Campaign is a key addition to that framework, giving simulation models real-world ice accretion data to improve confidence in icing prediction and aircraft certification methods.
The campaign fits into a larger NASA research arc that includes high-speed CRM, CRM-NLF, and CRM-HL configurations. By combining detailed tunnel data with ice mass and pressure measurements, NASA is helping designers predict icing effects earlier in development and build safer, more efficient transport aircraft. For anyone involved in certifying aircraft for flight into known icing, the inboard model dataset is a valuable reference. It is a map that helps engineers understand how swept wings respond when freezing conditions alter the leading edge.
Related in Scientific Research

Scientific Research
PLOS Climate: How Open Access is Reshaping Global Warming Research
The landscape of scientific communication is shifting rapidly. Integrity and accessibility are no longer just nice-to-haves but essential pillars of modern research. PLOS Climate stands at the center of this transformation. This journal from the Public Library of Science in Cali…
Read More...
Scientific Research
PLOS Climate: Navigating Broken Links to Access Critical Global Warming Research
The digital landscape of scientific publishing is shifting rapidly. For researchers and enthusiasts alike, the ability to access peer-reviewed work without barriers is essential. PLOS, a nonprofit based in California, has long championed open access. Their journal PLOS Climate f…
Read More...
Scientific Research
How PLOS Climate Is Reshaping Global Science: The Open Access Advantage
In the fast-moving world of scientific communication, open access journals are doing more than just sharing papers. They are breaking down walls that have long kept knowledge out of reach. PLOS Climate stands at the center of this shift. As a key part of the Public Library of Sc…
Read More...
Scientific Research
PLOS Climate: How Open Science is Reshaping Global Data Access
The digital landscape of scientific publishing is undergoing a profound transformation. This shift is driven by the urgent need for transparency and rapid dissemination of critical research. PLOS Climate stands at the forefront of this movement. It is a specialized journal dedic…
Read More...
Scientific Research
PLOS Climate 404 Errors: How Link Rot Threatens Scientific Trust and What You Can Do
The digital landscape of scientific communication is shifting rapidly. For researchers, policymakers, and educators, the integrity of open-access journals like PLOS Climate is not just a convenience but a necessity. Yet, even the most robust platforms face technical hurdles. A r…
Read More...
Scientific Research
PLOS Climate: How Open Access is Reshaping Global Warming Solutions
The landscape of scientific publishing is shifting beneath our feet. Accessibility and transparency are no longer just nice-to-have features; they are the bedrock upon which we address the most pressing challenges of our time. The Public Library of Science (PLOS), a nonprofit ba…
Read More...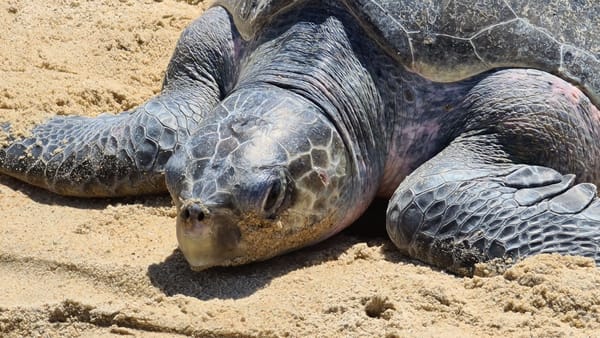
Scientific Research
California Beaches See First Olive Ridley Nesting: What This Means for Sea Turtle Conservation
Marine biologists are witnessing a historic shift in ocean ecology. On September 16, 2026, an olive ridley sea turtle laid eggs on a beach near Seal Beach in Orange County, California. This event marks the first confirmed nesting of this species on the U.S. West Coast. Historica…
Read More...
Scientific Research
PLOS Climate: Why Broken Links Threaten Global Science Access
The digital landscape of scientific communication is shifting beneath our feet. As climate research accelerates, the integrity and accessibility of this data have become paramount. Specialized journals like PLOS Climate face constant challenges regarding content availability and…
Read More...
Scientific Research
Why Climate Data Links Fail: The Open Access Fix You Need Now
Imagine clicking a link to the latest climate study only to hit a dead end. That frustrating 'Page Not Found' error is more than a technical glitch. It represents a significant barrier in the fight against misinformation and delayed action. When vital research on global warming…
Read More...
Scientific Research
What Color Is the Universe? The Surprising Beige Answer from Johns Hopkins
For centuries humanity has gazed into the night sky captivated by vibrant nebulae and dying stars. Yet a deceptively simple question remains elusive to the naked eye. What is the average color of the entire universe? The answer defies expectations of deep cosmic blues or brillia…
Read More...